Configure perfmon to monitor Requests/Sec, Request Execution Time and % Processor Time. Request execution time indicates the length of each request measured by IIS/ASP.NET.
Perfmon application is started by running the perfmon.exe application from the windows Run console. Please refer to the Perfmon help for instructions on how to use this application.
Use profiling in the Sitecore debugger to locate peak usage pages.
Sitecore allows to view the execution time for entire pages and individual renderings on your website. This is a useful tool for reducing the execution time of your website. The profiler is used in the following way:
- Login to the client.
- Enter http://<mysite>/?sc_debug=1 in your browser.
- Navigate to the page you want to profile.
- Move the mouse pointer right to the vertical scrollbar (a profiling pane should now appear to the right).
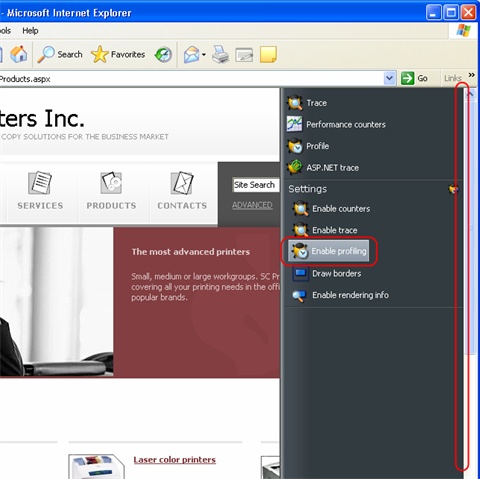
- Choose Enable Profiling.
- Open the pane once more and choose Profile.
A new window will open with the information about execution time of the entire page and individual renderings. 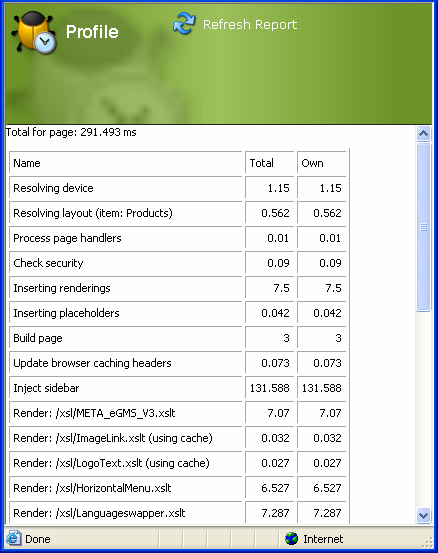
See also: Caching Renderings