Email channel performance
Get detailed reports of your email channel performance.
The analytics and reporting capabilities of the Email Experience Manager (EXM) enable you to evaluate your sent email campaigns and optimize future email campaigns.
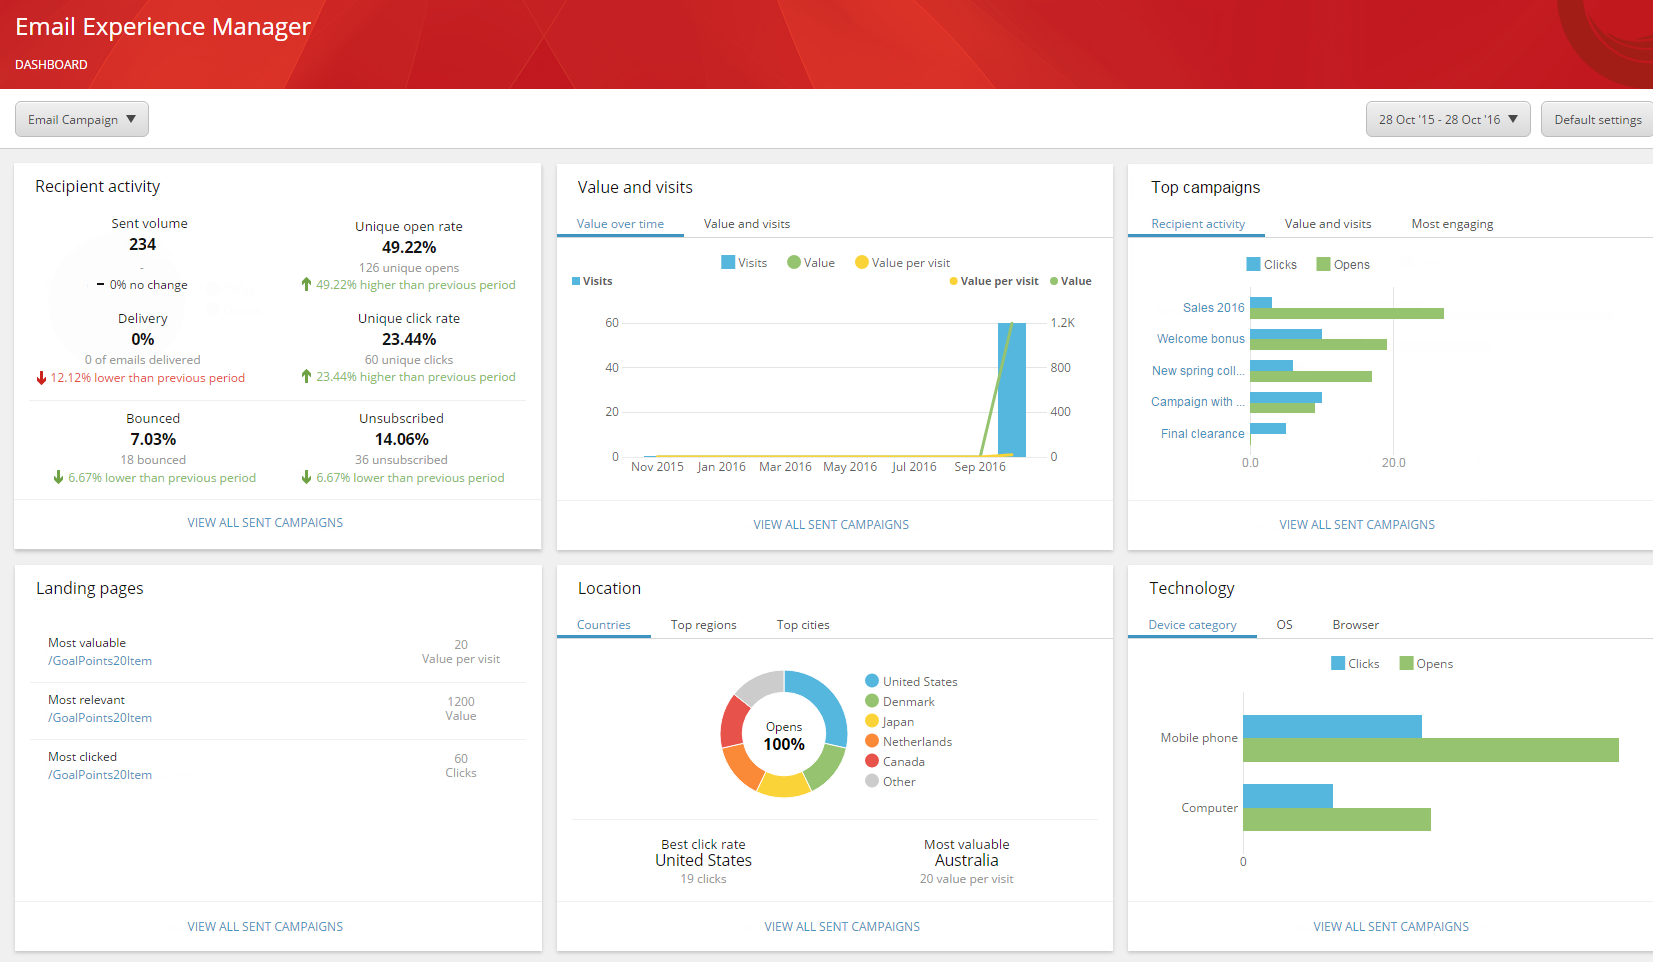
The EXM dashboard, gives you an overview of the performance and analytics of the email campaigns sent from the current manager root according to:
 |
Note
The reporting data on the EXM Dashboard and for an individual campaign have two separate caches that do not run simultaneously. This means that in some situations there may be a 15-minute discrepancy in the reporting data displayed on the Dashboard and the reporting data for an individual email campaign. You can configure these caches in the Website/App_Config/Include/ExperienceAnalytics/Sitecore.ExperienceAnalytics.WebAPI.config file.
The default date range is the past three months.
To see the reports for a specific date range, click the date drop-down menu and specify the relevant From and To dates or use one of the predefined date ranges, for example, Last week or Last month, and then click Apply.
 |
This report gives you a quick overview of the relevancy of your email campaigns by showing how your contacts have reacted to them.
The report shows how many contacts have opened an email campaign or clicked a link in the email message, how many did not receive your email campaign because the message bounced, and how many unsubscribed from an email campaign.
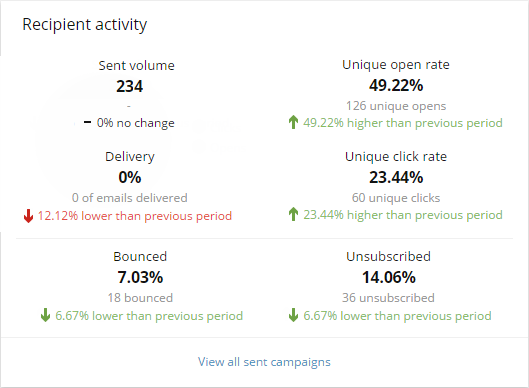 |
The table below shows the information contained in the Recipient Activity report.
The Recipient Activity Report | |
|---|---|
Sent volume | The total number of email messages that have sent from the current manager root. |
Delivery | The percentage of sent email messages that have been delivered successfully to a contact's inbox. (Total delivered / total sent ) * 100 |
Unique open rate | The percentage of contacts who opened one of your email messages, where contacts that open the same email campaign twice, only count as one. (Total unique opens / total sent ) * 100 |
Unique click rate | The percentage of contacts who opened and clicked a link in one of your email campaigns, where contacts that click more than one link in the same email campaign only count as one. (Total unique clicks / total sent) * 100 |
Bounced | The percentage of contacts who did not receive an email campaign as intended because it bounced. This could be either a soft bounce or a hard bounce. (Total bounces / total sent) * 100 |
Unsubscribed | The percentage of contacts who have unsubscribed from one of your email campaigns by clicking the Unsubscribe link in an email message. (Total unsubscribed / total sent) * 100 |
This report gives you an overview of the value and visits that your email channel has generated.
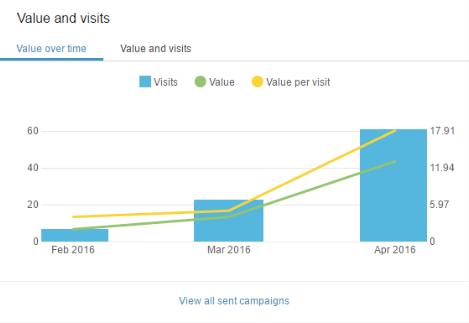
The Value over time tab – shows the value, the number of visits, and the value per visit that all your email campaigns have generated each month in the past three months. To see the graphs individually, click the labels, Visits, Value, and Value per visit to switch between the graphs.
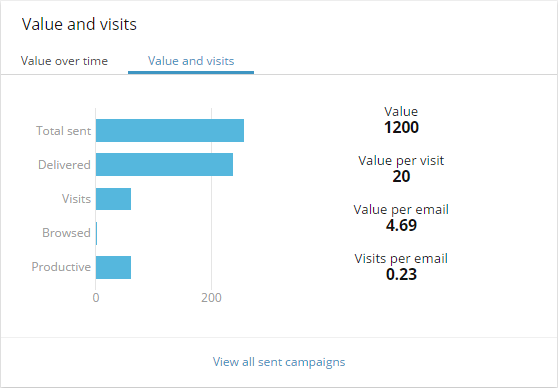
The Value and visits tab – gives you an overview of total value and visits that your email campaigns have generated.
The Value and visits tab
Total sent
The number of email campaigns that have been sent from the current manager root.
Delivered
The number email campaigns that have been delivered to a recipient.
Visits
The number of contacts that have clicked a link in an email message to visit your website.
Browsed
The number of contacts who viewed more than one webpage after coming to your website via the link in an email message.
Value
The total value that has been generated on your website by visits from your email campaigns.
Value per visit
The average value per visit that visits from your email campaigns have generated.
Value per email
The average value per email campaign that visits from your email campaigns have generated.
Visits per email
The average number of visits per email campaign.
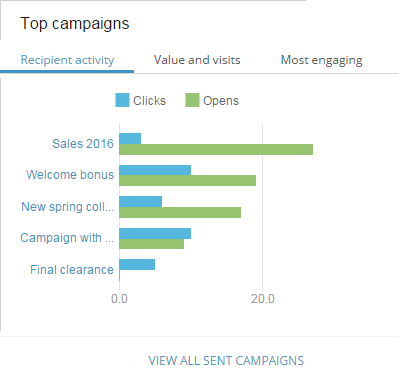
This report shows a list of the most successful email campaigns based on either the click or open rate or on the value and value per visit that the email campaign has generated:
The Recipient activity tab lists the five most successful email campaigns based on the click rate and/or the open rate. To switch between the views, click the Clicks and Opens links.
The Value and visits tab lists the most successful email campaigns based on either value or value per visit. Click the columns headers to sort the list accordingly.
The Most engaging tab lists the most successful email campaigns based on either the highest number of unique opens or unique clicks.
 |
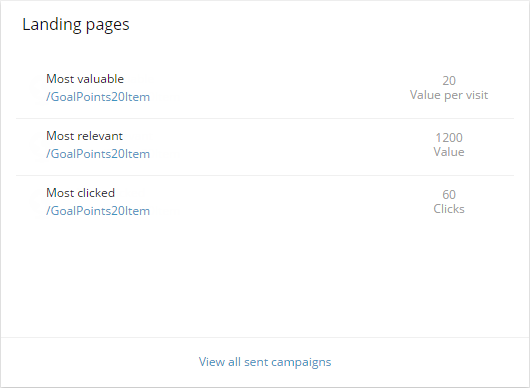
This report lists the most successful landing pages according to:
Most valuable – the landing page that has generated the most value per visit.
Most relevant – the landing page that has generated the most value.
Most clicked – the landing page where most contacts have clicked a link.
 |
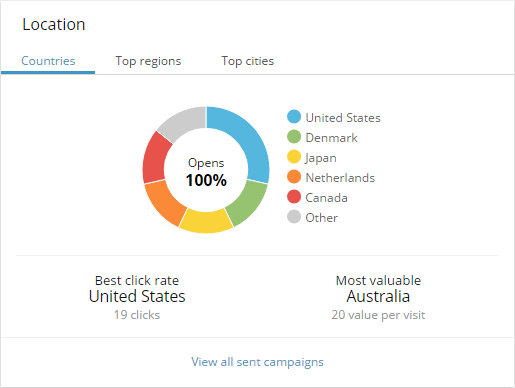
This report displays the reporting data for the top five countries, regions, and cities.
The Countries tab displays:
The number of opened email messages grouped by country.
The country with the highest click rate.
The country with the highest value per visit.
The Top regions tab and the Top cities tab display the number of opened email campaigns and the number of clicks grouped by region and city.
 |
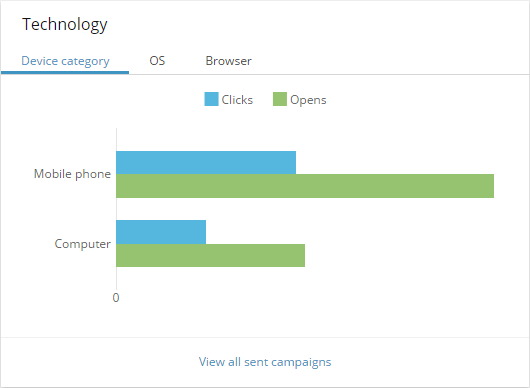
This displays the reporting data according to device, operating system, and browser.
The Device category tab displays the number of opened email campaigns and the number of clicks grouped by the type of device that the contacts have used.
The OS tab displays the reporting data according to the operating system that the contacts have used:
Opens – the number and percentage of opened email campaigns according to the operating system that the contacts have used.
Clicks – the number and percentage of clicks in your email campaigns according to the operating system that the contacts have used.
Value – the value and the percentage of the value that your email campaigns have generated according to the operating system that the contacts have used.
The Browser tab displays the number of opened email campaigns, clicks, and value generated from the email campaign according to the browser that the contacts have used.
 |