Email campaign reports
For all sent email campaigns, you can view the reporting details for an individual email campaign.
For each email campaign that you have sent with the Email Experience Manager (EXM), you get a range of reports that show you how the email campaign has performed and how the recipients have reacted.
To see the reports for a specific:
Regular email campaign, open the relevant email campaign from the EXM menu under the Reports section.
Active automated email campaign, open the relevant email campaign from the EXM menu under the Automated section.
In the list of sent email campaigns, you can see when each campaign was last updated in the Campaign updated column.
Note
The reporting data on the Dashboard and for an individual campaign has two separate caches that do not run simultaneously. This means that in some situations there may be a 15-minute discrepancy in the reporting data displayed on the Dashboard and the reporting data for an individual email campaign.
For each email campaign, reports are available on the following tabs:
Overview – shows a summary of the reporting data on recipient activity, landing pages, value and visits, location, and technology.
Recipient activity – shows details about the open rate and clicks that your email campaign has generated, and information about bounces, spam complaints, and unsubscribes.
Value and engagement – shows the value per visit over time and the engagement value that your email campaign has generated.
Landing page performance – shows details about the landing pages that your email campaign directs the recipients to, for example, the most clicked, most valuable, or most relevant.
Note
For multilanguage email campaigns, there are no reports available for a single language version of the email campaign. The reports for multilanguage email campaigns display information about all the available language versions together.
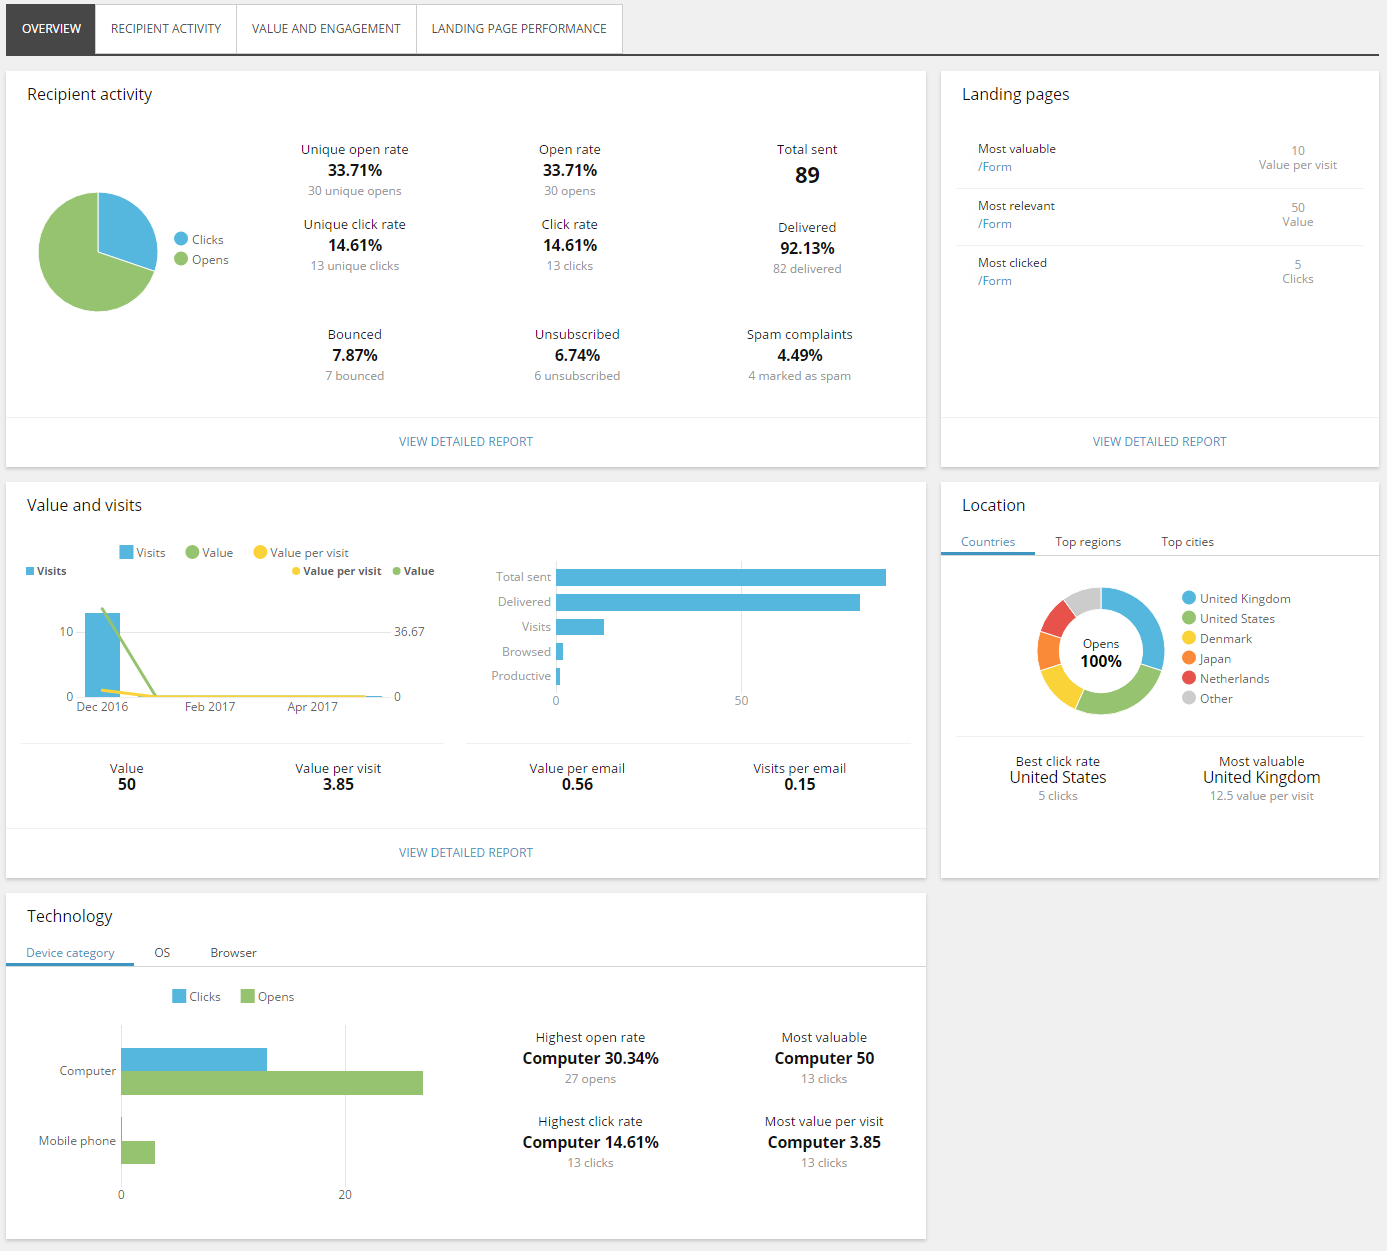
The Overview tab displays a summary of how the email campaign has performed according to recipient activity, landing pages, and value and visits. You can view more detailed information about these areas on the other tabs.
In addition, the Overview tab includes information about the locations from where the email campaign performs best and about the device, operating system, and browser that recipients have used.
 |
Location
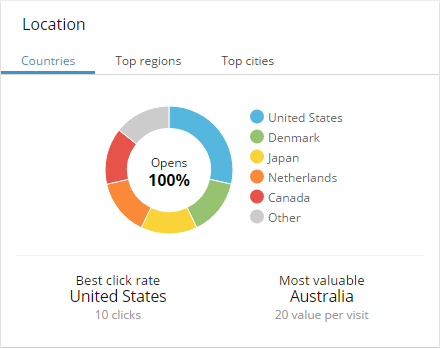
The location overview displays data collected about your email campaign according to country, region, and city.
The Countries tab displays:
The number of opened email messages grouped by country.
The country with the best click rate.
The country with the highest value per visit.
The Top regions tab and the Top cities tab display the number of opened email campaigns and the number of clicks grouped by region and city.
 |
Technology
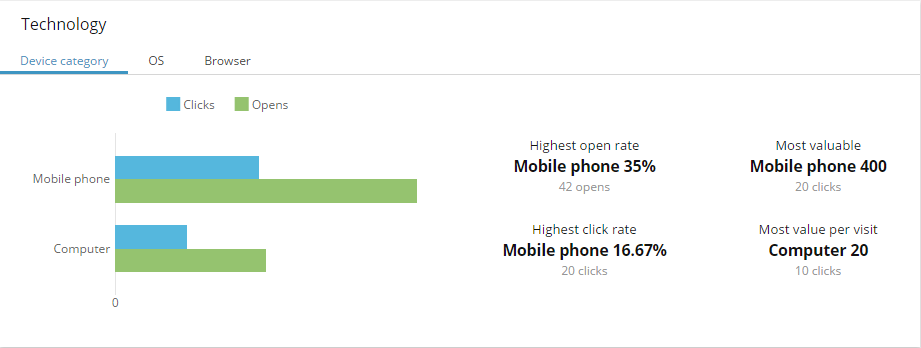
The technology overview displays data collected according to device, operating system, and browser.
The Device category tab displays the number of opened email campaigns and the number of clicks grouped by device, operating system, or browser that the contacts have used. In addition, you can see:
Highest open rate – the device, operating system, or browser from which the highest number of contacts have opened the email message.
Highest click rate – the device, operating system, or browser from which the highest number of contacts have clicked a link in the email message.
Most valuable – the device, operating system, or browser from which contacts have generated the highest value on your website.
Most value per visit – the device, operating system, or browser from which contacts have generated the highest value per visit on your website.
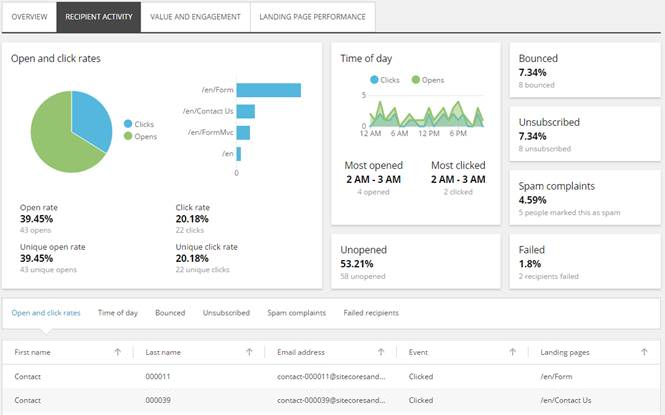
This report gives you an overview of the relevance of your email campaign by showing how the recipients have reacted to it.
The graphs at the top of the page give you a good overview of general recipient activity. In the list at the bottom of the page, you can see further details about the individual recipients, for example, who clicked a link in your email campaign and the landing page they visited, or who unsubscribed to your email campaign.
 |
Note
When EXM finishes a dispatch of a campaign, even if there are failed recipients, the email campaign status changes to Completed. On the Recipient activity tab, in the Failed section, you can see the number of contacts that the campaign was not delivered to. Details about the recipients that did not receive the email campaign are listed in the Failed recipients list.
EXM measures the recipient activity according to the following parameters:
Recipient activity | Description |
|---|---|
Open rate | The number of times that the email message in the email campaign has been opened. Regardless of how many times a contact opens the email message, every time is counted. |
Click rate | The number of times that a link in the email message has been clicked. Regardless of how many times a contact clicks a link in an email message, every time is counted. |
Unique open rate | The percentage of contacts who opened one of your email messages. Contacts that have opened the same email campaign twice only count as one open. (Total unique opens / total sent ) * 100 |
Unique click rate | The percentage of the contacts who opened and clicked a link in the email campaign. Contacts that have clicked more than one link in the same email campaign only count as one click. (Total unique clicks / total sent) * 100 |
Time of day | The hourly intervals where the most recipients opened your email campaign or clicked a link. |
Unopened | The percentage of contacts that have not opened your email campaign. (Total unopened / Total sent ) * 100 |
Bounced | The percentage of contacts who did not receive the email campaign as intended because it bounced. This can be either a soft bounce or a hard bounce. (Total bounces / total sent) * 100 |
Unsubscribed | The percentage of contacts who have unsubscribed from the email campaign by clicking the Unsubscribe link in the email message. (Total unsubscribed / total sent) * 100 |
Spam complaints | The number of contacts that have marked the email message as spam. |
Failed | The number of contacts in the included lists that the email message could not be delivered to. |
Note
The lists display 20 rows at a time.
The Value and engagement tab shows details of how effective the email campaign is in generating value and visits to your website.
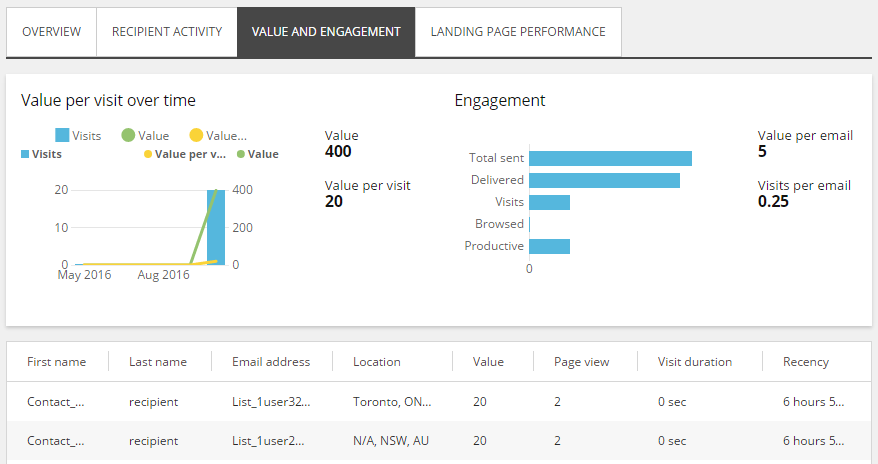 |
The graphs at the top of the page show the value, the number of visits, and the value per visit that your email campaign has generated each month for the past three months.
The list at the bottom of the page displays details about each recipient of this email campaign, for example, the value they have generated, the number of page views, and the duration of the visit.
EXM measures the value and engagement according to the following parameters:
Value and visits | Description |
|---|---|
Total sent | The number of email messages that have been sent in the email campaign. |
Delivered | The number of email messages that have been successfully delivered to a recipient's inbox. |
Visits | The number of recipients that visited your website by clicking a link in the email message. |
Browsed | The number of recipients who viewed more than one page after coming to your website through a link in the email message. |
Productive | The number of contacts who generated value after visiting the website. |
Value | The total value that recipients have generated on your website through visits from your email campaign. |
Value per visit | The average value per visit that visits from your email campaign have generated. |
Value per email | The average value per email message that visits from your email campaign have generated. |
Visits per email | The average number of visits per email campaign. |
Note
The lists display 20 rows at a time.
The Landing page performance tab shows details for each of the landing pages that your email campaign leads to.
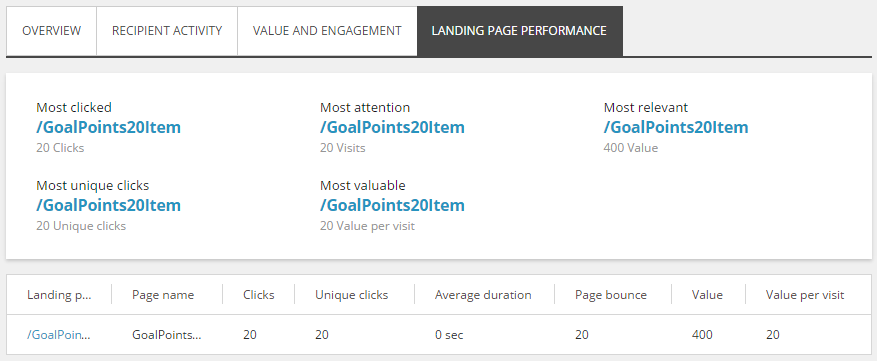 |
The graphs at the top of the page give you an overview of the landing pages that have performed the best. The list at the bottom of the page displays details about each landing page, for example, the value that recipients generated on that page, the number of clicks, and the average duration of a visit.
EXM measures the landing page performance according to the following parameters:
Landing page performance | Description |
|---|---|
Most clicked | The landing page that most recipients clicked a link to from the email message. |
Most unique clicks | The landing page where most unique recipients clicked a link. |
Most attention | The landing page that has had the most visits from your email campaign. |
Most valuable | The landing page that has generated the highest value per visit. |
Most relevant | The landing page that has generated the highest value |
Note
The lists display 20 rows at a time.