The Conversions tab reports
The Conversions tab contains reports about target actions completed by your contacts.
In the Experience Analytics dashboard, the Conversions tab contains reports about contacts that complete target actions and achieve particular goals. These reports help you to assess which target actions generate the most value and to understand how well your marketing efforts are working.
The Conversions tab consists of four subtabs:
Note
The tabs can contain duplicate reports showing the same data presented in a different way. For example, in a graph and in a pie chart. This topic does not describe each duplicate report.
You can find detailed technical information for every report, including duplicate reports and drill-down information, in the Sitecore Experience Analytics Standard Reports document.
The Experience Analytics glossary of terms can also help you to understand the reports.
Tabs | Reports | |
|---|---|---|
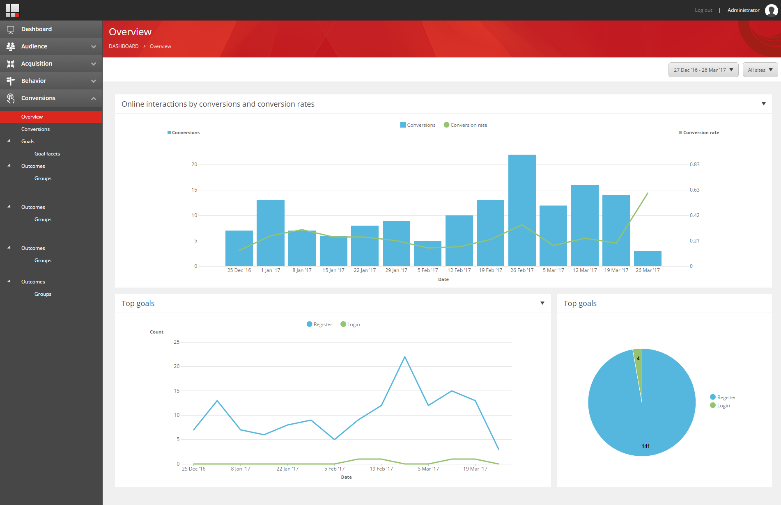
Overview Shows an overview of the key analytics reports on the Conversions tab.
| Online interactions by conversions and conversion rates The percentage of interactions that have a conversion as well as the total number of conversions. Top goals The top goals converted on your site. | |
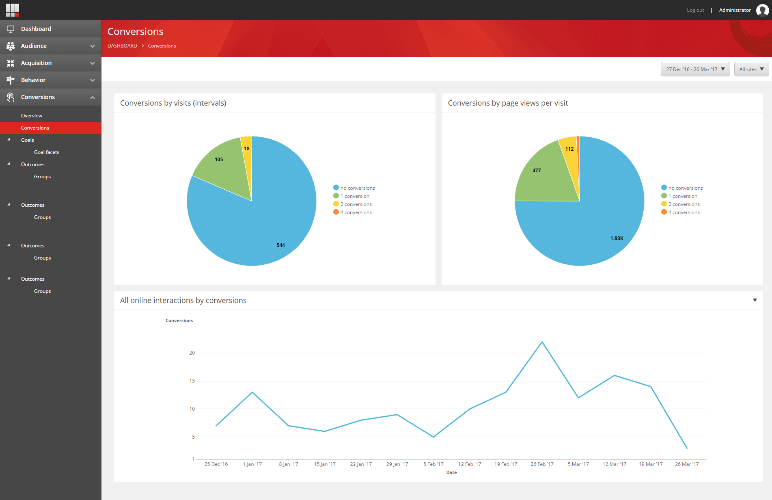
Conversions Shows an overview of how often your contacts are converting on your sites.
| Conversions by visits (intervals) The number of times your contacts are converting per visit. Conversions by page views per visit The number of times your contacts are converting, by page views. All online interactions by conversions The number of interactions where conversions took place one or more times. | |
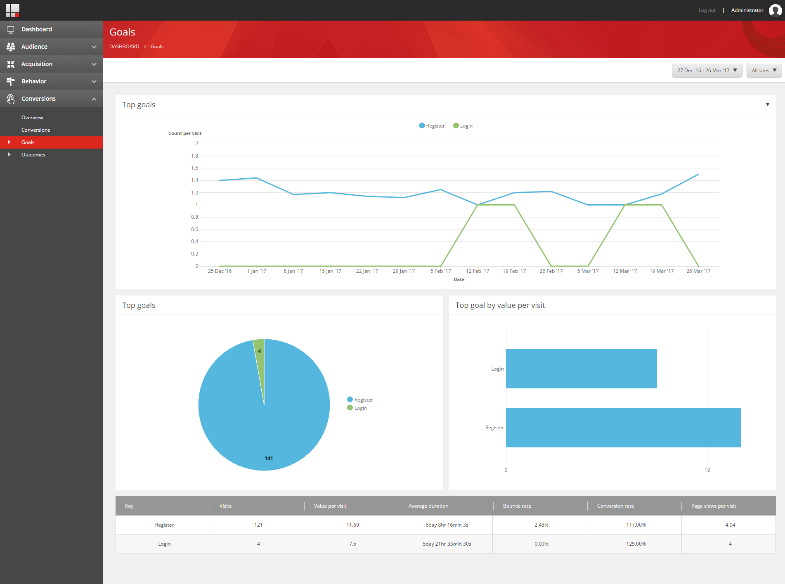
Goals Describes the goals that help you measure the effectiveness of your campaigns.
| Top goals The goals achieved by your contacts. Top goal by value per visit The goals that have provided the highest average engagement value generated per visit. Table Lists all goals and includes detailed metrics. | |
Goal facets Describes the different aspects of a goal that you want to track, such as a category or description of related goals. 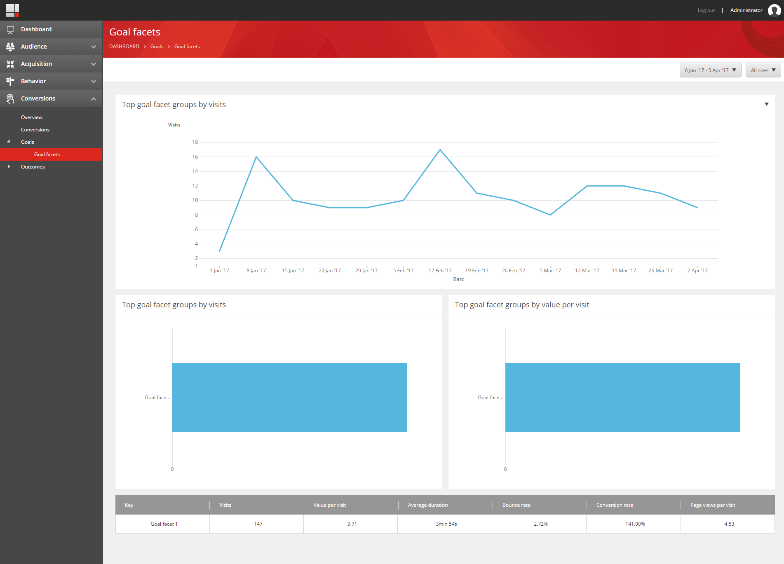 | Top goal facet groups by visits The goal facet groups with the highest number of visits to your website. Top goal facet groups by value per visit The goal facet groups that have provided the highest average engagement value generated per visit. Table Lists all goal facets and includes detailed metrics. | |
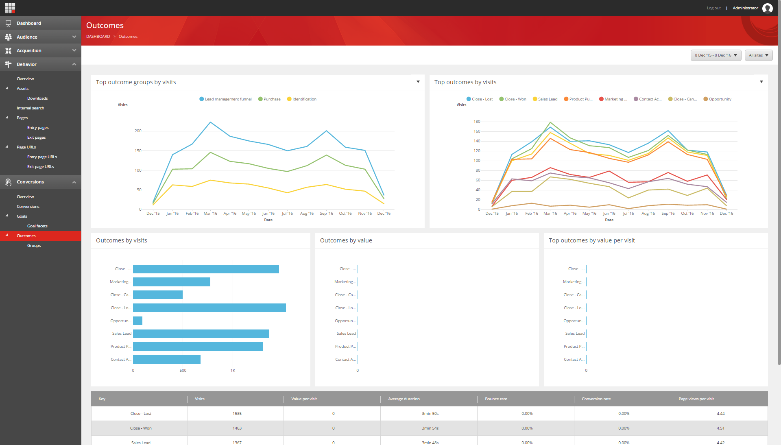
Outcomes Describes outcomes or business-significant results of one or more interactions between a contact and your organization.
| Top outcome groups by visits The outcome groups with the highest number of visits to your website. Top outcomes by visits The outcomes with the highest number of visits to your website. Outcomes by visits The outcomes with the highest number of visits to your website. Outcomes by value The outcomes that have accumulated the highest number of engagement value points during visits. Top outcomes by value per visit The outcomes that have provided the highest average engagement value generated per visit. Table Lists all specific outcomes and includes detailed metrics. | |
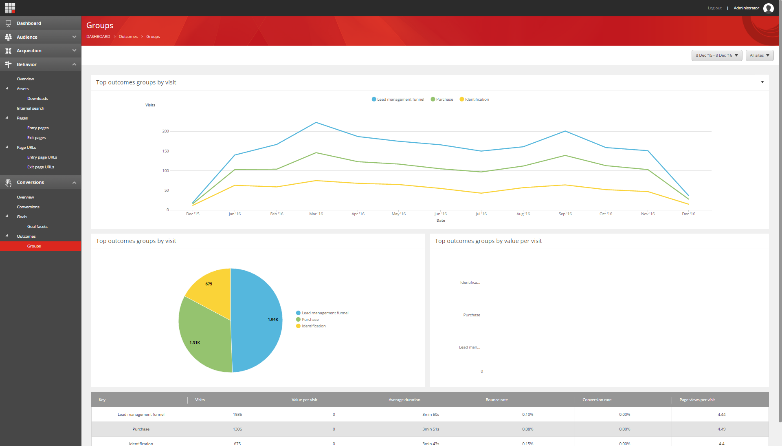
Groups Describes outcomes, further divided into groups.
| Top outcomes groups by visit The outcome groups with the highest number of visits to your website. Top outcomes groups by value per visit The outcome groups that have provided the highest average engagement value generated per visit. Table Lists all outcome groups and includes detailed metrics. |
