The Experience Analytics reports for marketers
The Experience Analytics reports most useful for marketers.
Sitecore Experience Analytics provides dashboards and reports for marketers and marketing analysts to identify patterns and trends in experience data. This data is collected from websites and other external data sources.
Experience Analytics contains a number of reports that analyze how contacts engage with your website. You can also create and configure custom reports in Experience Analytics. In your daily activities as a marketer, some reports may be more relevant than others.
This information can help you analyze the amount of traffic on your website, as well as the quality of that traffic. You can use this information to refine and optimize your campaigns.
You can find the most popular reports for marketers in:
Note
You can find detailed technical information for every report, including duplicate reports and drill-down information, in the Sitecore Experience Analytics Standard Reports document.
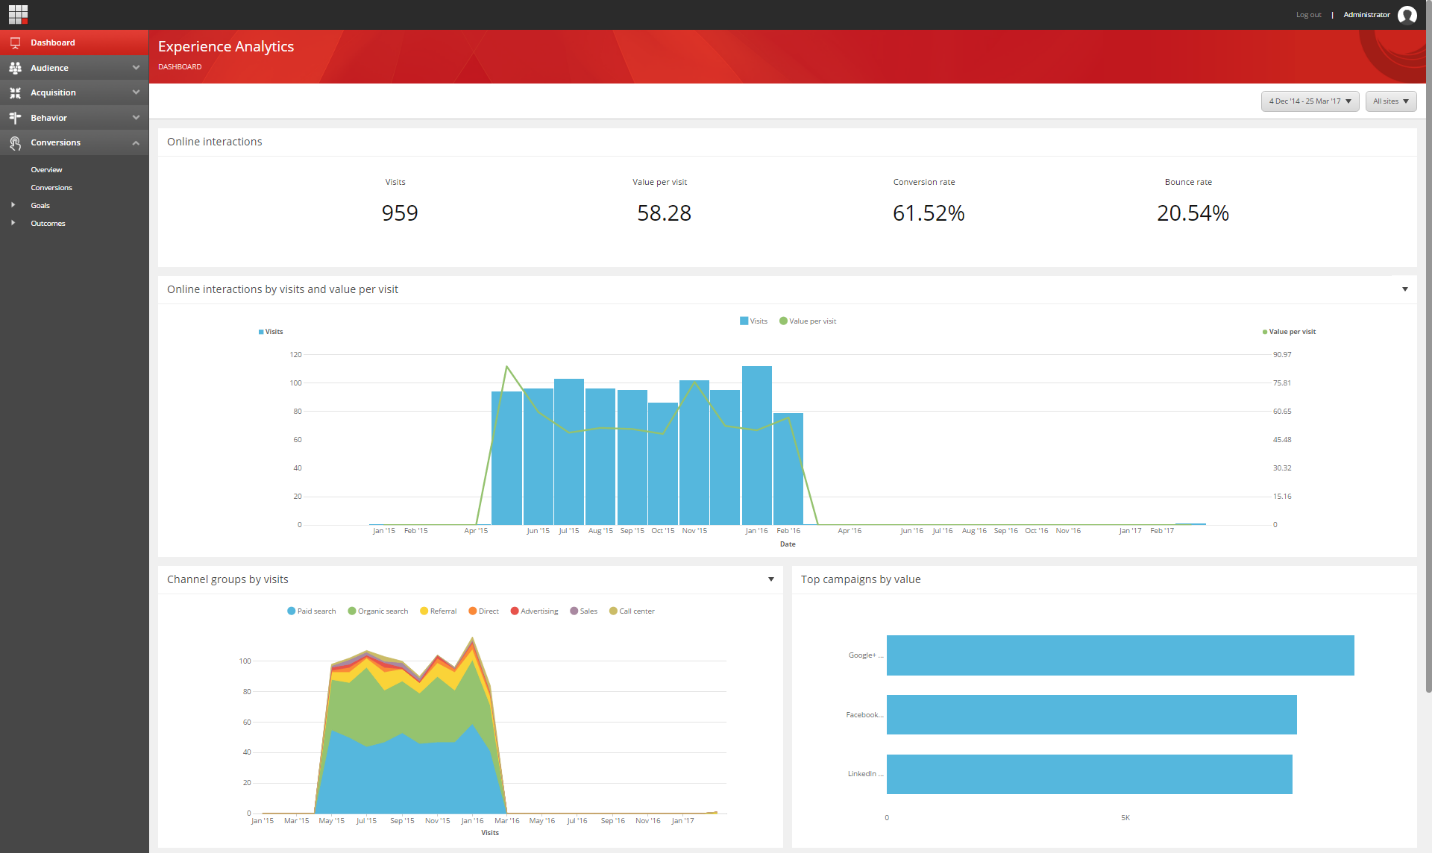
The Experience Analytics Dashboard contains five of the most popular charts and graphs that provide general overviews of contact activities on your website. You can use the Dashboard to identify general marketing trends on your website. You can find these charts and graphs under other categories in xAnalytics.
The charts included in the Dashboard are:
Charts | Description |
|---|---|
Online interactions by visits and value per visit | Shows the number of visits within a selected period and the average engagement value generated per visit. |
Channels groups by visit | Illustrates how much traffic has come to your website and how much traffic each channel has generated. |
Top campaigns by value | Shows you which campaigns have accrued the highest number of engagement value points. |
Top pattern matches by value per visit | Shows which pattern cards that contacts have matched, provided the highest engagement value per visit. |
Top goals by conversions | Shows you which goals have been converted the most |
 |
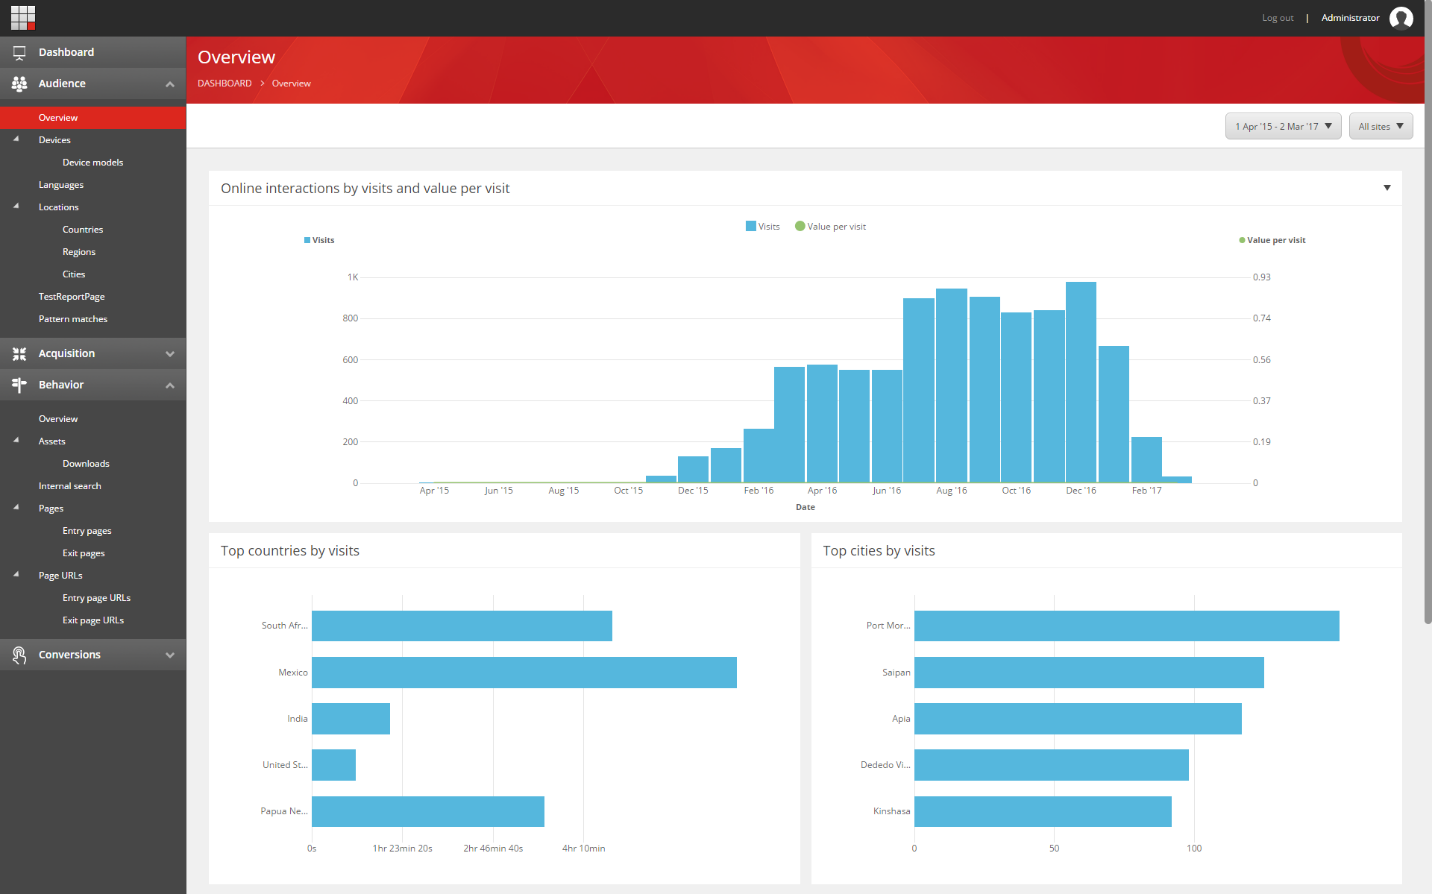
The Audience tab helps you gain a better understanding of who your website visitors or contacts are.
In this tab you can find the Pattern Matches report, which shows you the most common pattern matches and those that provide the highest value per visit. You can also find analytics information about devices used to access your website, as well as languages and locations.
The Audience tab also contains a detail report where you can view information about the number of visits, value per visit, average duration, bounce rate, conversion rate and page views per visit for each pattern card.
 |
On the Acquisition tab, you can find analytics data about what drives online traffic to your website. For example, from which channel sources your website is acquiring or getting visitors from, how your campaigns are performing, the goals that are getting users to convert from, or keywords used to find your website, among others.
The Acquisition tab shows the following charts and dashboards:
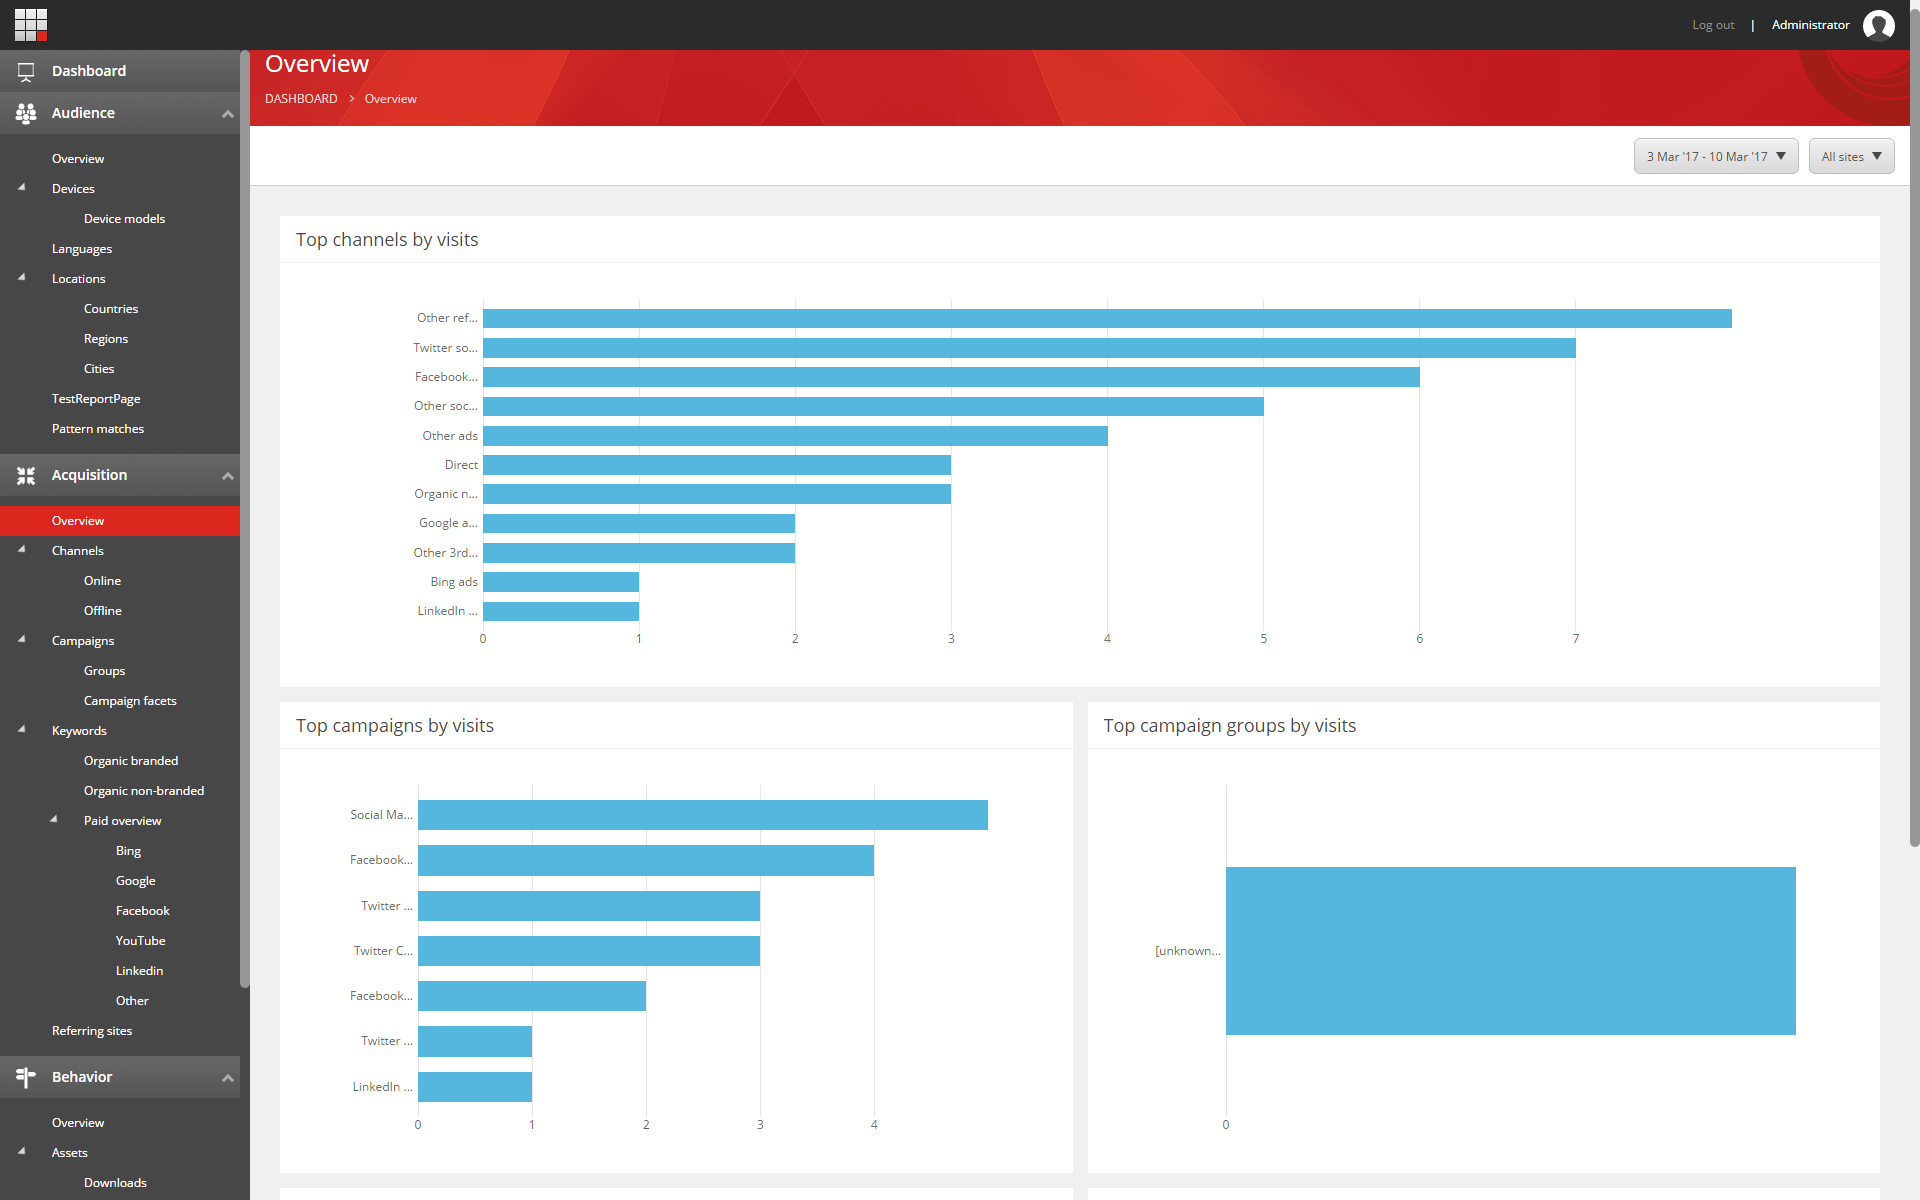
Overview – contains five reports that cover high-level information about channels, campaigns, and keywords that contacts use to find your website.
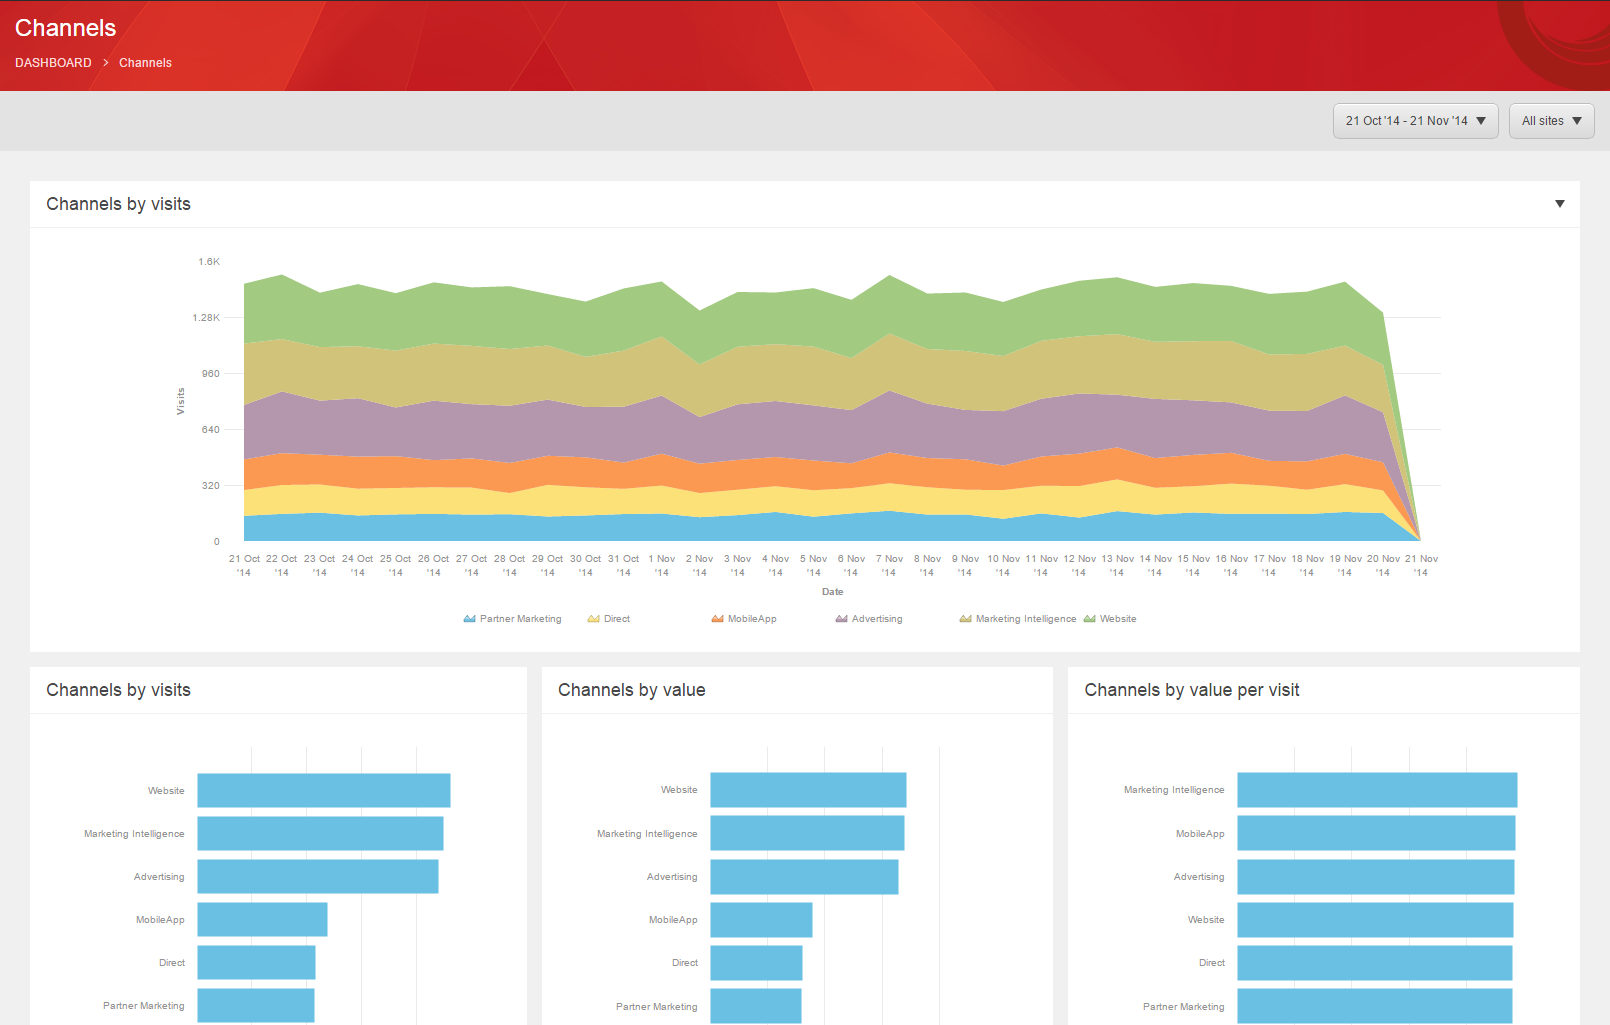
The Channels dashboard provides you with information about channel traffic by visits. You can also view charts that organize your website's channels by value and by value per visit.
The Campaigns dashboard shows you graphs and reports that show you your top campaigns by visits and by value per visit.
You can also view a more detailed report about your campaigns and campaign groups, which contains information about the value per visit, average duration, bounce rate, conversion rate and page views per visit for your campaigns.

The Referring sites dashboard provides you with information about the top referring sites by visit and the top referring sites by value per visit. There is also a referring sites detail report.
The Conversions tab show which behaviors by your website visitors generate the most value, which goals are converting, as well as a summary of the number of conversions, among others
The Conversions Overview provides you with information about online interactions by conversions and conversion rates. It also provides a chart and graph showing the top goals by count.
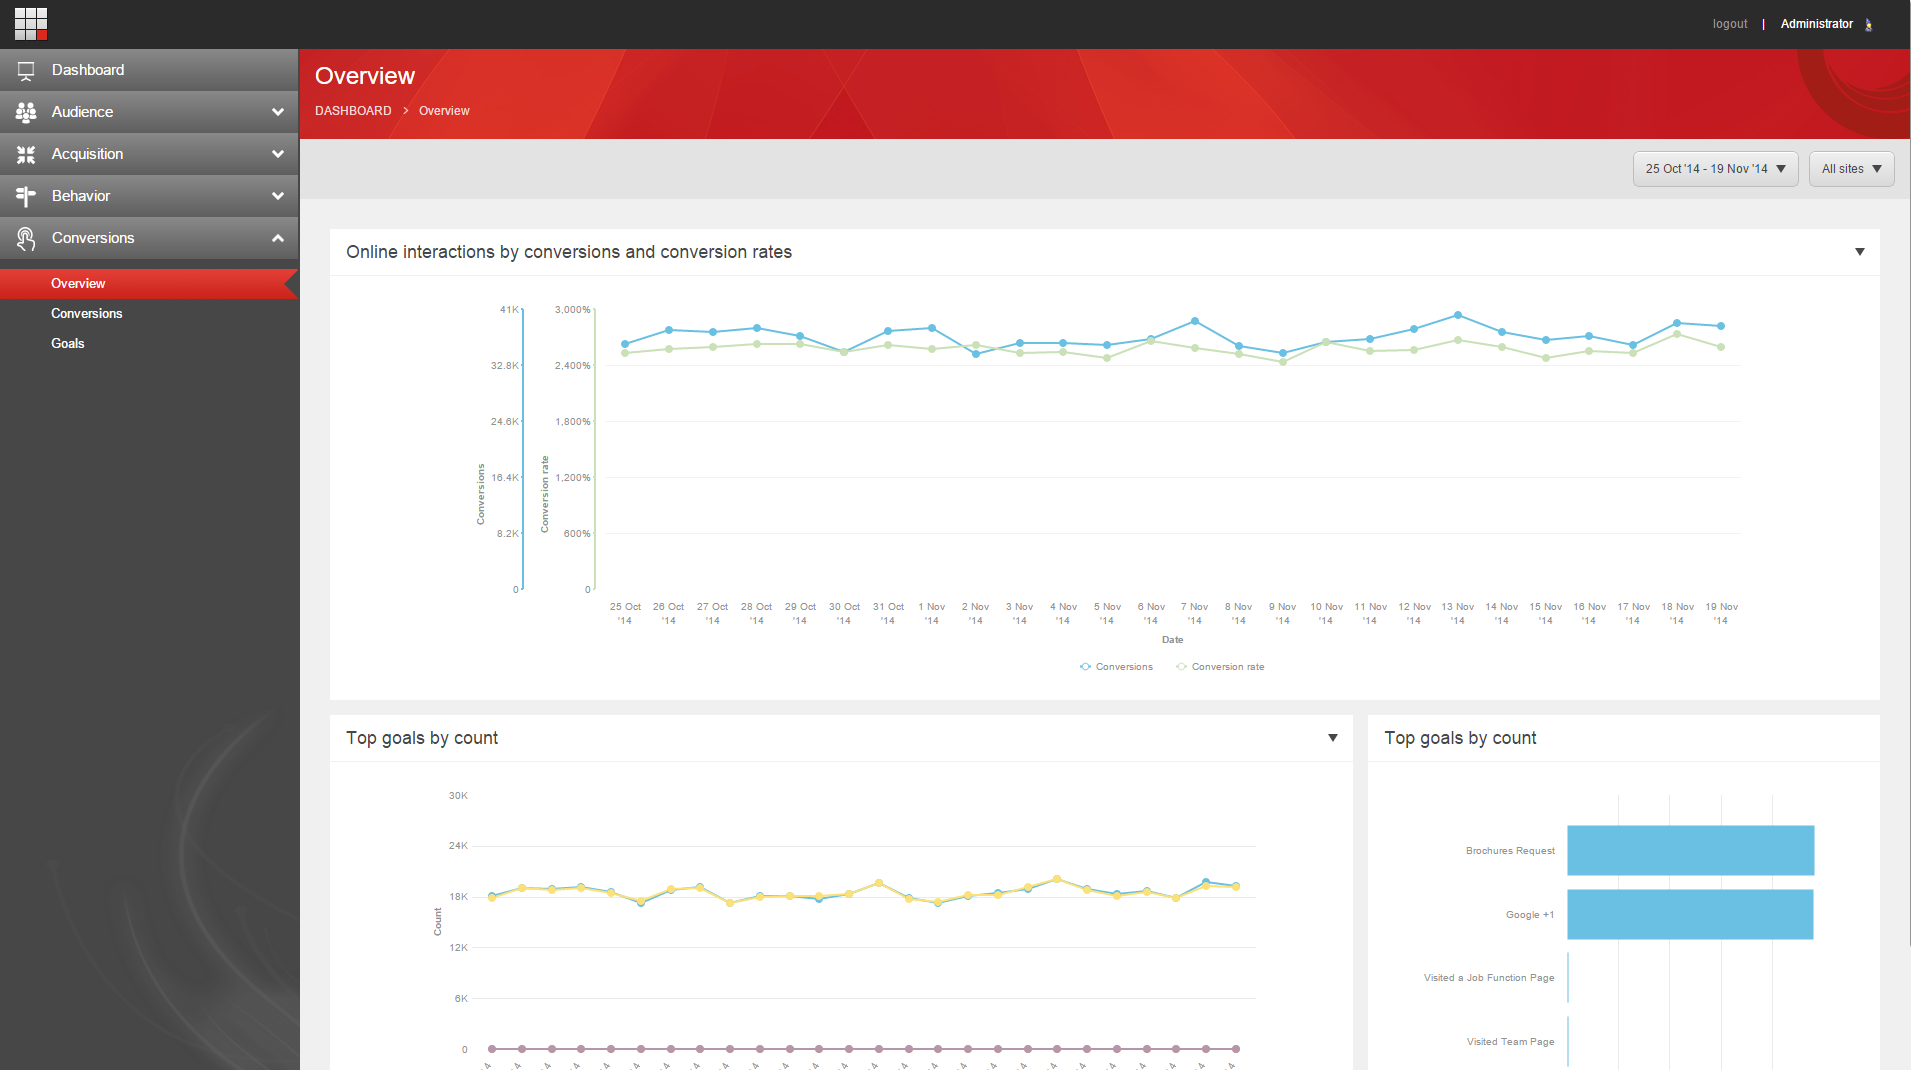
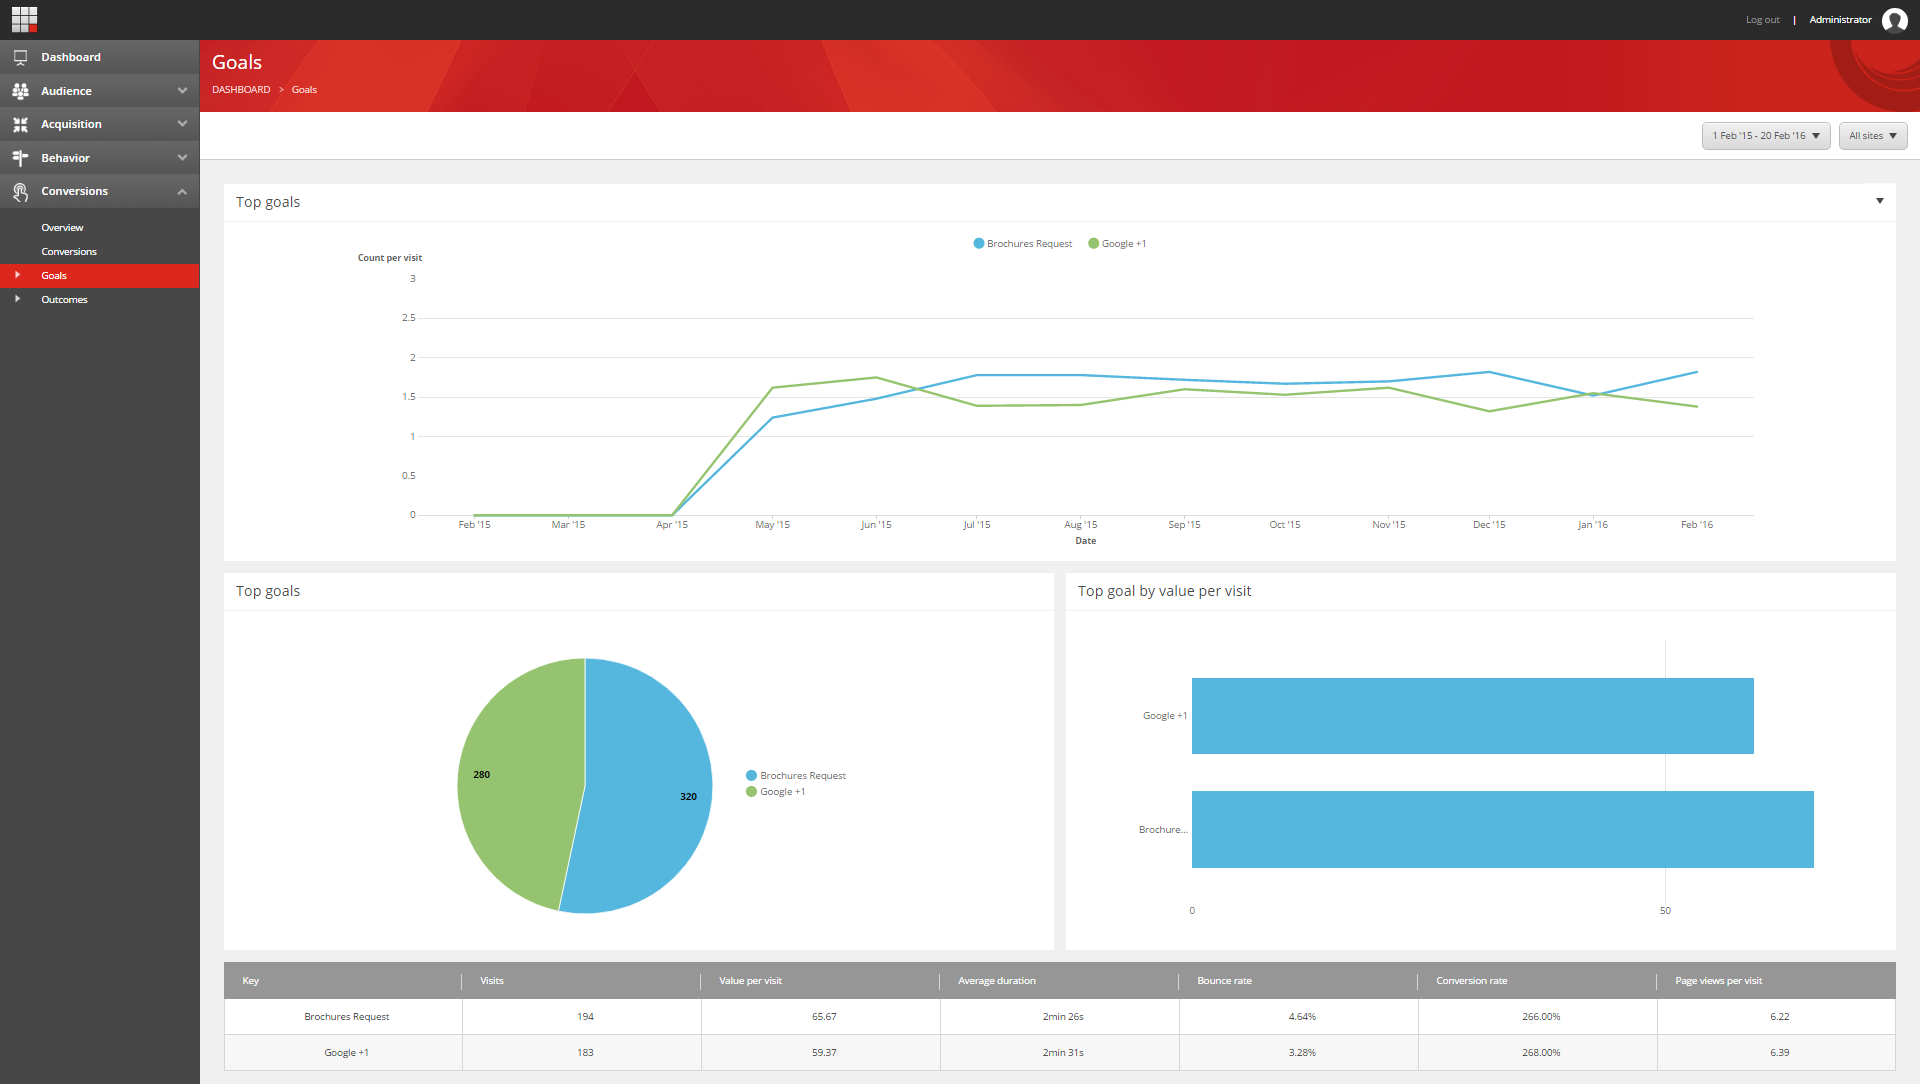
Under Conversions, the Goals reports focus on the goals that have the highest number of conversions. You can also view the goals that have the highest conversion rates.
For more information about the charts and reports that are available on each tab, see: